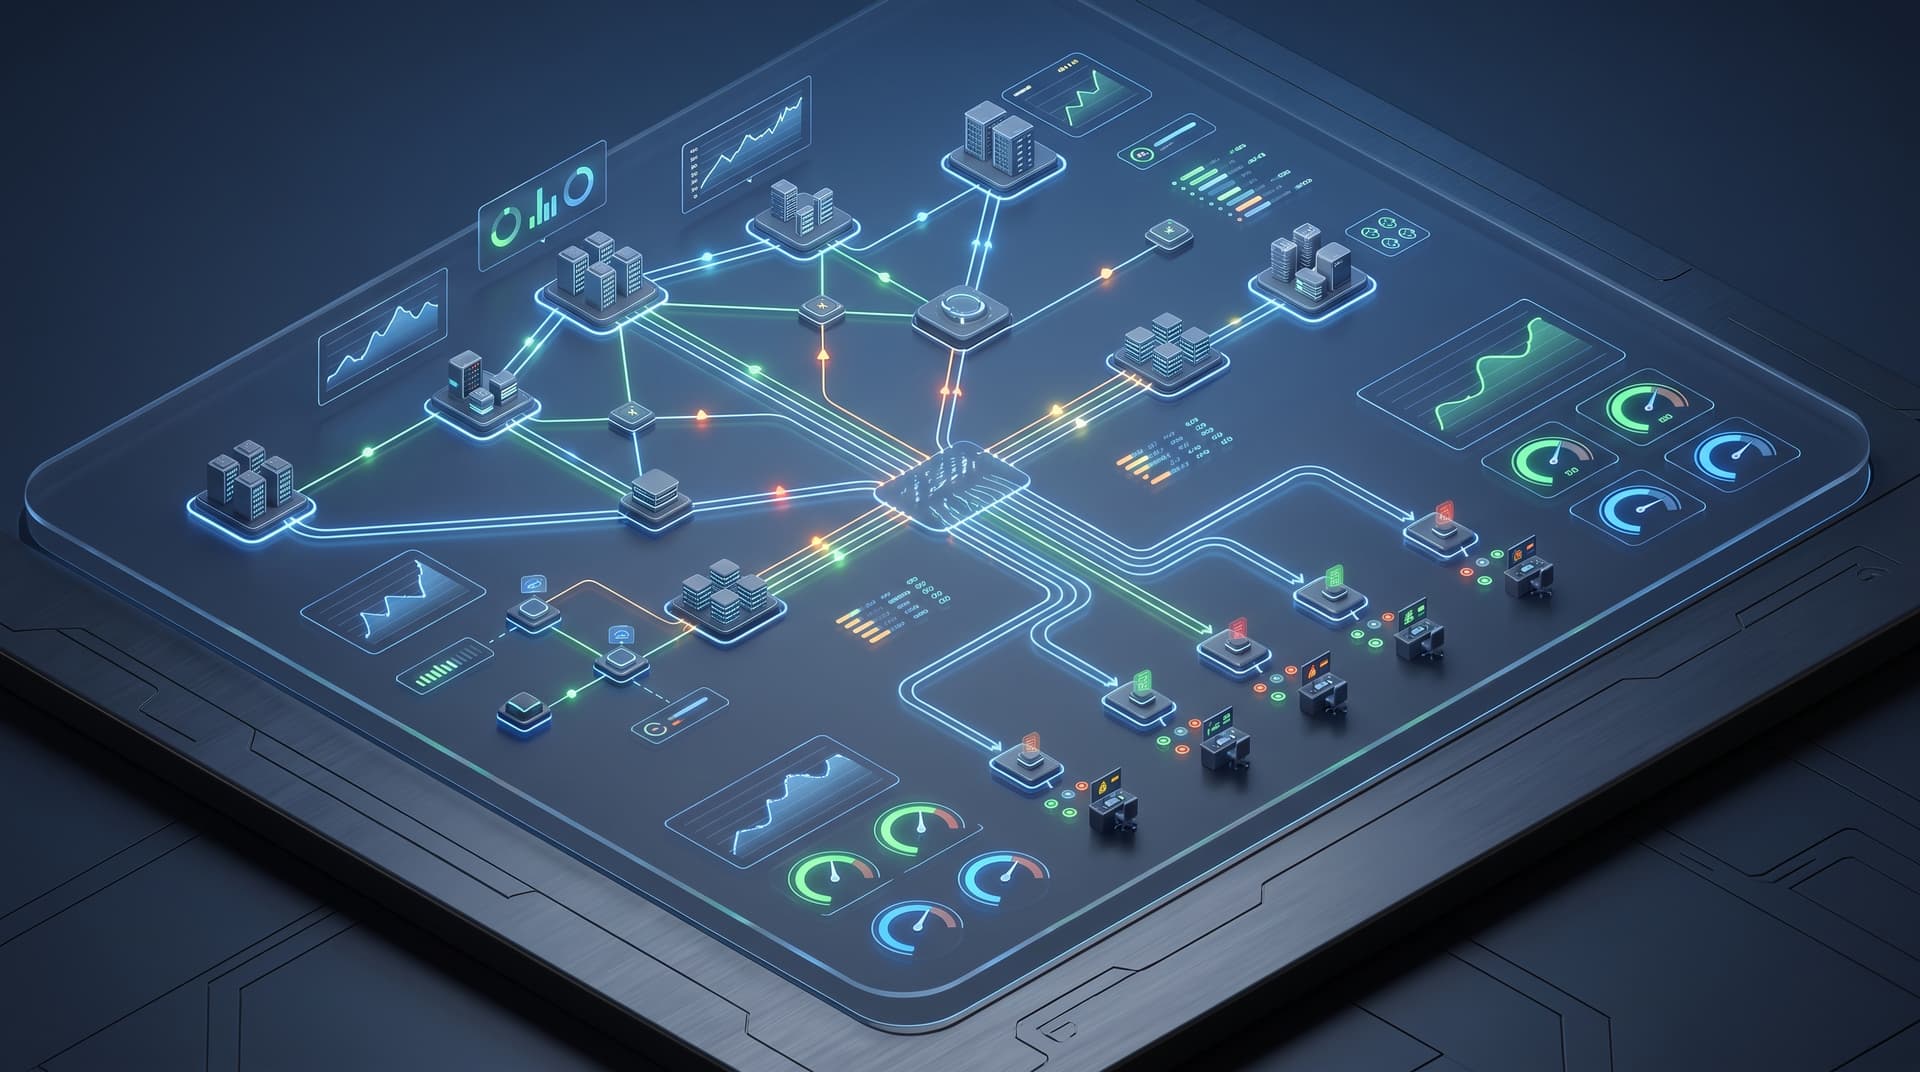
Monitoring software excels at generating signals. Remote Monitoring and Management (RMM) agents, network probing tools, and cloud telemetry services continuously scan CPU utilization, memory thresholds, disk space, interface status, and network latency. Yet, for many operations leaders, an abundance of telemetry produces operational anxiety rather than diagnostic clarity. When every temporary performance spike triggers an urgent notification, critical outage warnings get buried in a relentless flood of low-priority noise.
The root of this operational friction lies in confusing telemetry generation with true incident response. Telemetry is passive data collection; incident response is active operational decision-making. Installing an agent on a server or configuring SNMP traps on a core switch creates awareness, but awareness without explicit ownership, contextual runbooks, and clear communication workflows achieves very little.
When engineers receive dozens of uncontextualized notifications every morning, alert fatigue inevitably sets in. Critical outage warnings are overlooked or deferred, response times stretch from minutes to hours, and mean time to resolution (MTTR) steadily deteriorates. For multi-site organizations operating with mixed bandwidth, variable latency, and localized ISP instability, raw alerting models break down even faster. To build resilient systems, operations leaders must transition from collecting passive notifications to architecting a disciplined, response-driven operational framework.
The Three Pillars of Meaningful Response: Ownership, Runbooks, and Communication
Transforming raw telemetry into swift incident resolution requires three foundational operational pillars: clear incident ownership, deterministic runbooks, and structured client communication.
1. Explicit Incident Ownership
A notification sent to a general team email alias or a broadcast Slack channel belongs to everyone and no one simultaneously. Without explicit assignment logic, team members assume someone else is actively investigating the issue. Every alert category and severity tier must map directly to a primary role or automated triage queue. When an incident triggers, the system must immediately assign a single primary owner responsible for initiating triage, maintaining operational status logs, and bringing the event to closure.
2. Actionable Runbooks Linked Directly to Signals
An alert reading "High Disk I/O on Host 04" provides diagnostic context, not a solution. An effective response architecture pairs every critical signal with a runbook link directly in the notification payload. Runbooks should not be static, high-level policy documents; they must detail exact diagnostic commands, immediate remediation steps, rollback procedures, and escalation criteria. If a database log partition hits 95% capacity, the runbook should explicitly state which temporary files can be purged safely, which service commands to run, and when to request a volume expansion.
3. Transparent Stakeholder and Client Communication
When an infrastructure incident impacts operational capabilities, internal stakeholders and affected clients require proactive updates. Silent troubleshooting creates anxiety and drives up helpdesk inbound volume. An integrated response framework separates internal technical remediation logs from external status updates. Automated notification pipelines ought to publish clear, plain-language status messages to client portals or designated contacts, outlining what is impacted, current mitigation efforts, and the expected timeframe for the next update.
Tuning Thresholds and Managing Uneven Multi-Site Networks
For multi-site organizations—such as regional healthcare clinics, logistics hubs, or manufacturing facilities—network infrastructure is rarely uniform. Primary headquarters may enjoy redundant gigabit fiber, while branch offices rely on commercial broadband or cellular failover connections. Applying uniform monitoring thresholds across all locations creates an operational nightmare.
In variable network environments, brief packet loss or transient latency spikes are routine occurrences, not immediate catastrophic outages. Standard RMM configurations often fire immediate high-severity alerts upon missing two consecutive ICMP pings. In a branch office with high local jitter, this generates constant alert flapping—where services repeatedly cycle between warning and clear states.
To prevent flap fatigue while maintaining true operational vigilance, monitoring architectures must employ adaptive threshold tuning:
- Consecutive Hold-Off Windows: Require conditions to persist across multiple evaluation cycles (e.g., sustained ping loss over 5 minutes) before generating an incident ticket.
- Dependency Awareness: Link downstream devices to core gateways. If the primary branch router goes offline, the monitoring system should suppress alerts for downstream switches and endpoints, raising a single root-cause gateway incident.
- Dynamic Hysteresis: Establish differential thresholds for clearing alerts. For example, trigger a high CPU alert when utilization exceeds 90% for 10 minutes, but only return to normal status when utilization drops below 75% for 5 minutes.
Illustrative Alert Tuning Matrix for Multi-Site Infrastructure
| Alert Category | Signal Trigger Condition | Evaluation Hold-Off | Auto-Suppression & Routing Logic |
|---|---|---|---|
| Core Gateway Loss | 100% ping loss over 3 cycles | 2 Minutes | Root-Cause Incident (P1 On-Call Paging) |
| Branch Endpoint Offline | ICMP Ping Timeout | 10 Minutes | Suppress if Branch Gateway is unreachable |
| Storage Utilization | > 90% space consumed | Immediate | Route to Tier 2 Queue; suppress duplicates for 12h |
| Transient CPU Spike | > 95% CPU utilization | 15 Minutes | Suppress during scheduled backup maintenance |
Structuring Escalation Tiers and After-Hours Operations
Not all infrastructure incidents require immediate wake-up calls. An effective operational structure categorizes alerts by business impact and assigns distinct escalation paths and response SLAs.
Tiered Escalation Architecture
- Tier 1 (Automated Self-Healing & Scripted Triage): Non-critical events, such as temporary service stalls or secondary log volume growth, should trigger automated remediation scripts (e.g., restarting a stuck print spooler or clearing temp directories). If automation succeeds, the ticket is logged and closed without human interruption.
- Tier 2 (Standard Working-Hours Queue): Warning-level alerts that do not impair immediate core operations—such as secondary disk usage passing 80% or non-critical backup warnings—are routed to the standard service desk queue for resolution during business hours.
- Tier 3 (Immediate On-Call Response): Critical P1 outages, including core firewall failures, active ransomware indicators, or total multi-site gateway disconnects, trigger active on-call paging with strict response targets.
Preventing After-Hours Burnout
After-hours paging must be strictly reserved for operational events that actively threaten business continuity, data integrity, or security posture. Routing non-critical warnings to an on-call engineer at 2:00 AM damages team morale and breeds dangerous alert fatigue. Implementing strict verification policies ensures that after-hours alerts fire only when validated across multiple external vantage points.
Measuring Operational Progress: MTTR and Signal Efficiency
To continuously refine incident management, operations leaders must track key performance indicators that isolate noise from resolution speed.
Key Operational Metrics
- Mean Time to Acknowledge (MTTA): Measures the elapsed time from alert generation to explicit owner assignment. A decreasing MTTA signals clear escalation paths and active queue management.
- Mean Time to Resolution (MTTR): Tracks the duration between initial incident detection and complete service restoration. Direct runbook integration into alert payloads drives consistent MTTR reductions.
- Signal-to-Noise Ratio (SNR): Measures the proportion of generated alerts that require actual manual intervention or verified automated remediation versus false positives and suppressed noise.
- Alert Flap Rate: Tracks the frequency of recurring transient warnings within short timeframes. High flap rates highlight prime candidates for threshold adjustments.
Takeaway: True operational efficiency isn't measured by how many alerts your RMM platform can generate, but by how few unnecessary disruptions reach your engineering team and how rapidly critical issues are resolved through runbook automation.
Overhaul Your Infrastructure Monitoring with Bitscaled
Building a quiet, highly responsive infrastructure monitoring framework requires deliberate strategy, accurate threshold tuning, and disciplined escalation design. If your organization is overwhelmed by constant RMM noise, unclear incident ownership, or delayed multi-site resolutions, Bitscaled can help you transform your operations.
Explore our comprehensive Infrastructure Monitoring Services to evaluate your current architecture, or contact our technical team to ask Bitscaled to tune monitoring thresholds and define alert ownership for your environment.