Beyond Telemetry: Distinguishing Monitoring From Meaningful Incident Response
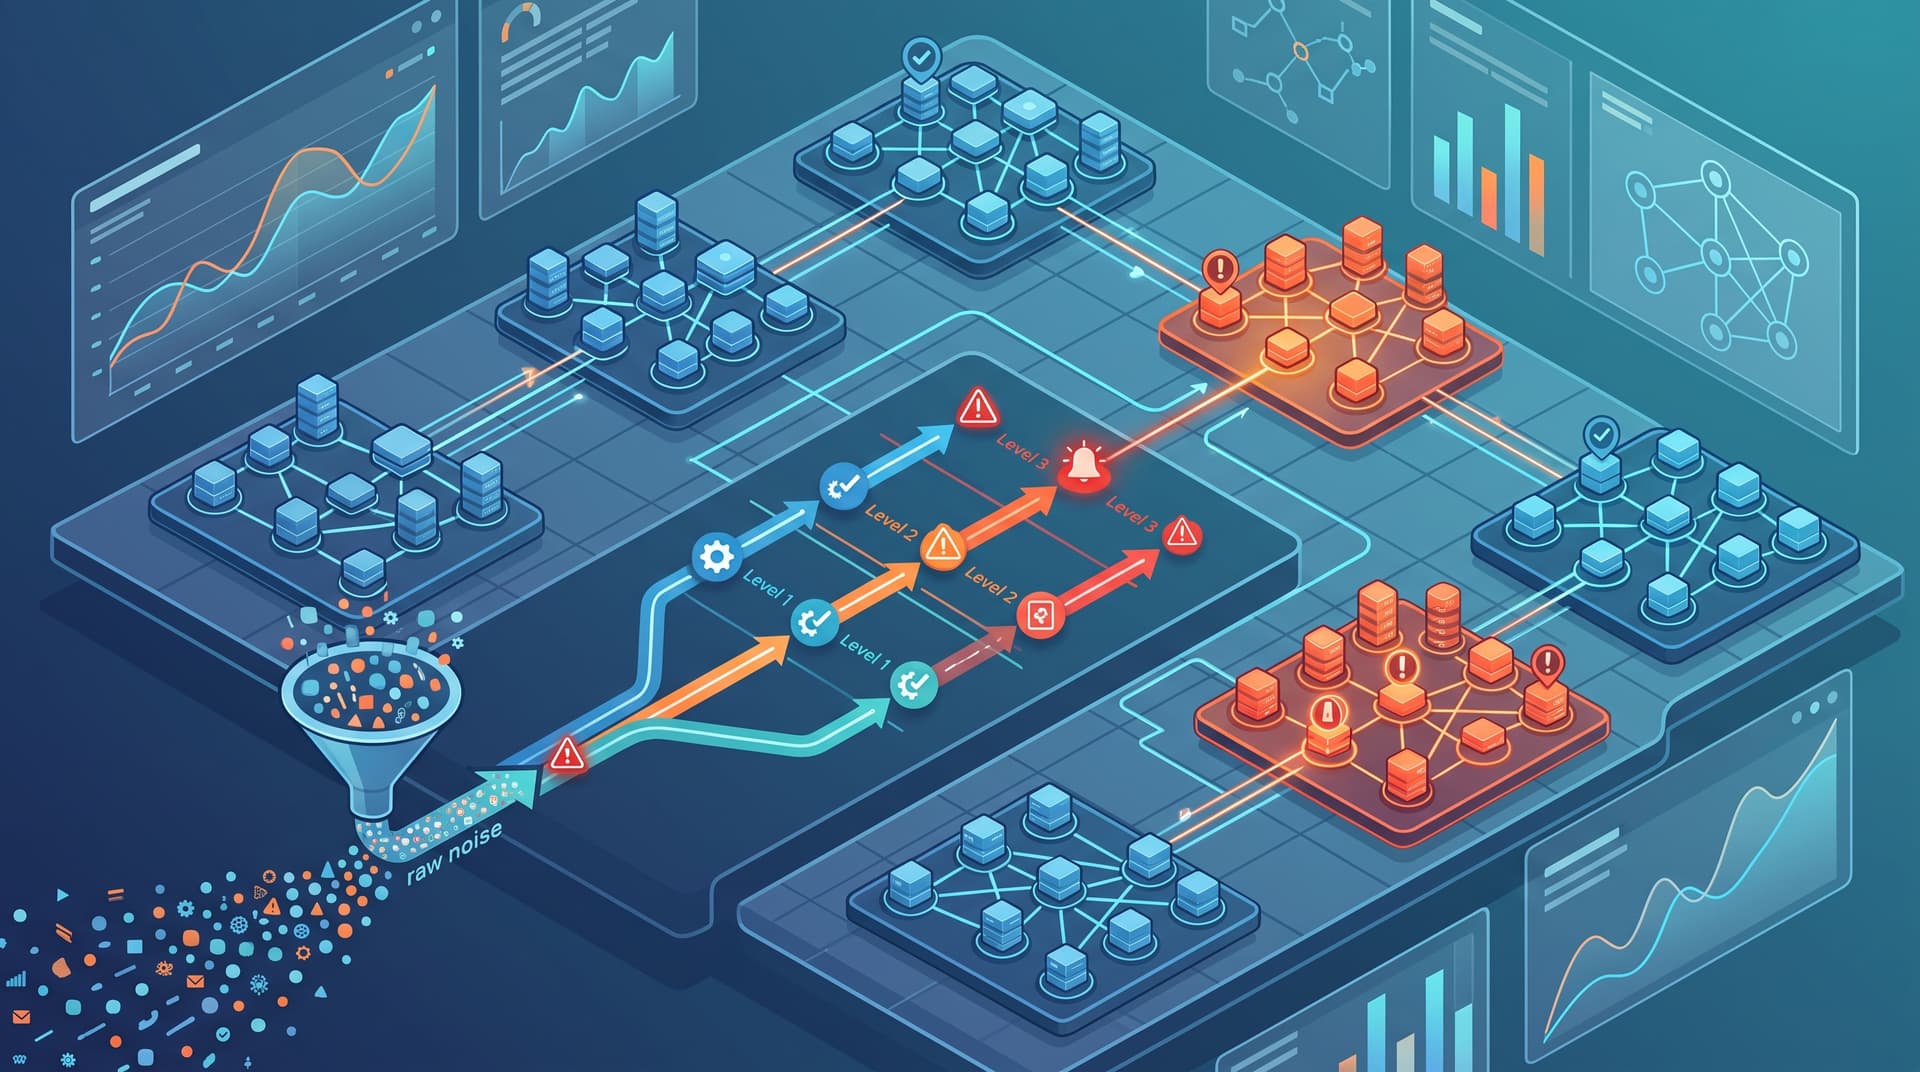
Modern enterprise IT management is rarely plagued by a lack of monitoring data. Remote Monitoring and Management (RMM) platforms, cloud telemetry agents, endpoint sensors, and network probes generate millions of events daily. However, an abundance of data frequently translates into an overwhelming volume of ambient noise. When every CPU spike, transient packet drop, or temporary backup delay triggers a high-severity notification, operations teams rapidly succumb to alert fatigue. When alerts arrive continuously without clear context, critical incidents get buried alongside routine non-actionable events.
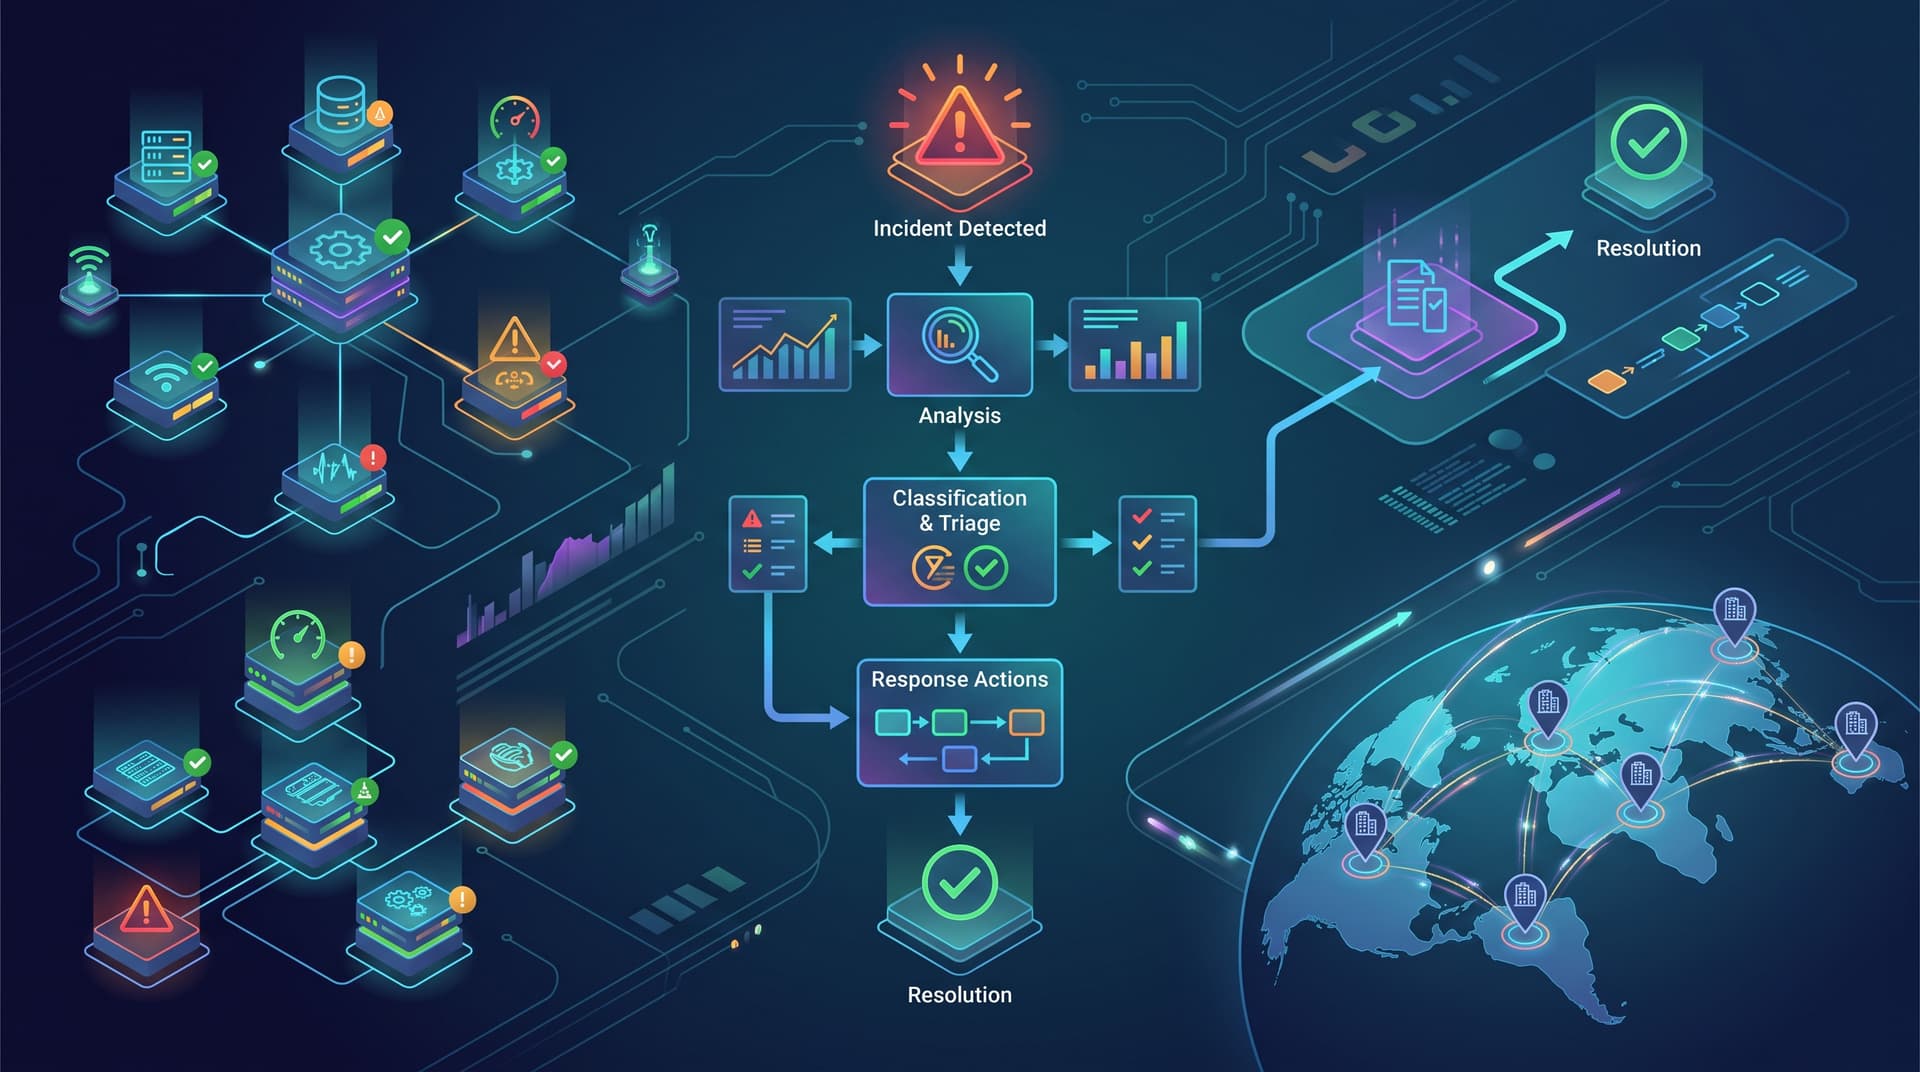
The fundamental breakdown in modern infrastructure operations occurs when organizations confuse monitoring with incident response. Monitoring is passive observation—the collection, ingestion, and metric visualization of telemetry across systems. Response, by contrast, is an active operational process—the immediate execution of a defined decision matrix, direct owner assignment, and targeted remediation when a system deviates from expected behavior. Ingesting a stream of ping failures into a dashboard does not resolve an outage; a clear escalation path, an executed runbook, and transparent stakeholder communication do.
To transition from passive observation to proactive operational resilience, infrastructure leaders must restructure how telemetry transitions into action. This requires clear ownership frameworks, rigorous threshold tuning, structured escalation tiers, and specialized handling for challenging environments such as multi-site SMB networks with uneven connectivity.
Defining Ownership, Runbooks, and Client Communication
An alert without an explicit owner is merely a notification destined for isolation. In many operations environments, alerts are blasted to a shared inbox, Slack channel, or broad distribution list. When everyone is responsible for an alert, no one is.
1. Accountable Ownership Assignment
Every operational alert generated by monitoring systems must automatically map to a designated role—not a general group—based on service classification and severity.
- Primary Responder: The frontline engineer responsible for acknowledging the event within the defined Service Level Agreement (SLA) window and initiating initial triage.
- Secondary Escalation Owner: The tier-two or domain specialist who assumes responsibility if triage exceeds predefined time limits or if the issue requires advanced technical intervention.
- Incident Commander: For critical outages (Severity 1), a designated leader oversees cross-functional coordination, client communications, and vendor escalation, allowing technical engineers to focus strictly on root-cause analysis and system restoration.
2. Standardized, Execution-Ready Runbooks
An alert should never force an engineer to start troubleshooting from scratch at 2:00 AM. Every high-priority notification must be paired with an accessible, step-by-step runbook embedded directly within the ticket or alert metadata. A complete runbook includes:
- Scope and Impact Assessment: Clear guidance on how to verify if the issue is impacting end-users or isolated to a non-critical background process.
- Initial Diagnostic Commands: Pre-approved diagnostic commands, scripts, or dashboard queries to establish immediate visibility without guessing.
- Remediation Procedures: Step-by-step recovery workflows, including service restart commands, failover triggers, and rollback procedures.
- Escalation Triggers: Specific criteria (e.g., failure to recover after 15 minutes or host unresponsiveness) that mandate immediate escalation.
3. Proactive Stakeholder and Client Communication
Technical remediation is only half the battle during an active incident. Uninformed clients or business unit leaders naturally escalate through management channels, creating unnecessary friction and distraction for response teams. Establishing automated, structured communication cadence ensures transparency:
| Incident Severity | Internal Response SLA | Stakeholder Update Frequency | Primary Communication Channel |
|---|---|---|---|
| Severity 1 (Critical) | < 15 Minutes | Every 30 Minutes until resolved | Automated Status Page & SMS Broadcast |
| Severity 2 (High) | < 30 Minutes | Every 2 Hours or on status change | Ticket Portal & Direct Email |
| Severity 3 (Moderate) | < 2 Hours | Daily or upon resolution | Integrated Service Desk Portal |
| Severity 4 (Low/Informational) | Next Business Day | Upon resolution | Service Desk Digest |
Illustrative Incident Escalation & Communication Matrix
Systematic Alert Tuning: Filtering Noise and Preventing Flapping
Alert fatigue is an operational failure caused by improper threshold calibration and unmanaged telemetry. When system engineers receive hundreds of unactionable alerts daily, their cognitive load increases, response times slow down, and catastrophic outages are easily overlooked.
Eliminating Flapping Alerts
Flapping occurs when a resource hovers endlessly around a trigger threshold—such as a network link fluctuating between 89% and 91% packet loss or a server CPU bouncing across 90% utilization every few seconds. To eliminate flapping:
- Hysteresis Implementation: Define distinct trigger and clear thresholds. For example, trigger a high-memory alert when utilization reaches 90%, but do not clear the alert until utilization drops below 80% for at least 10 consecutive minutes.
- Time-Based Persistence Filters: Require a metric to remain in a degraded state for a sustained window (e.g., 5 to 15 minutes) before generating an actionable incident. Transient spikes lasting seconds should be logged as telemetry, not dispatched as alerts.
- Dynamic Baselining: Replace static thresholds with dynamic baselines that account for cyclical work patterns. A backup server experiencing 95% CPU utilization at 2:00 AM during a scheduled maintenance window is normal; the same server hitting 95% at 2:00 PM indicates an anomaly.
Takeaway: If an alert does not require immediate, manual intervention or trigger an automated self-healing action, it should not notify an engineer on call. Reclassifying non-actionable warnings into background reporting metrics is the single most effective step toward reducing operational burn-out.
Escalation Tiers and Sustainable After-Hours Handling
Unrestricted after-hours dispatching leads to team burnout, elevated turnover, and high rates of human error during production outages. Sustainable incident response requires clear escalation paths and strict criteria for off-hours wake-ups.
Structuring After-Hours Boundaries
Not every alert generated outside normal business hours justifies paging an on-call engineer. Organizations must implement a strict triage funnel:
- Paging Criteria (Severe Impact Only): Reserve after-hours audio/SMS paging strictly for Severity 1 events that impact core revenue-generating systems, multi-site security, or critical production environments without redundancy.
- Delayed Dispatch for Severity 2/3: Secondary issues—such as non-critical disk space warnings, localized printer server offline events, or single redundant power supply failures—are queued automatically for triage at the start of the next business day.
- Rotational Fairness and Compensation: Implement structured on-call schedules with fair rotation schedules, shift-handoff documentation, and compensatory time off following nocturnal incident resolutions.
Multi-Site Operations: Managing Uneven Network Quality
For multi-site Small and Medium-Sized Businesses (SMBs)—such as regional logistics hubs, multi-branch healthcare clinics, or distributed manufacturing facilities—monitoring presents unique challenges. Branch sites often rely on consumer-grade broadband, satellite, or cellular fallback connections with variable latency, jitter, and frequent transient dropouts.
Applying standard enterprise monitoring thresholds across uneven network infrastructure results in hundreds of false-positive "Site Down" alerts whenever an ISP drops packets for a few seconds.
Tailoring Telemetry for Distributed Branch Environments
To maintain reliable visibility without flooding operations with false alarms across multi-site environments, deploy these field-tested strategies:
- Probe Dependency Modeling: Map device monitoring hierarchically. Configure external probes to check local gateway routers before monitoring downstream switches or point-of-sale terminals. If the primary gateway ping fails, suppress alerts for all downstream branch devices and consolidate them into a single "Branch Gateway Unreachable" event.
- Dual-Path and Multi-Location Verification: Avoid triggering outage workflows based on a single external telemetry probe. Require monitoring engines to confirm a site loss from at least two independent geographic monitoring locations or verify local router state via a secondary cellular WAN interface before paging engineers.
- Latency & Jitter Buffer Tuning: Adjust packet-loss and ping latency thresholds specifically for branch locations operating on non-terrestrial or legacy broadband links. Increase ping timeout tolerances from 500ms to 2000ms and extend heartbeat check intervals to match local network constraints.
- Edge Survivability Telemetry: Utilize local edge appliances or lightweight monitoring nodes that cache logs and metrics locally during WAN disconnects. Once connectivity restores, the edge node uploads the historical buffer without treating the temporary WAN disconnect as an internal system crash.
Measuring Operational Progress: MTTR, MTTA, and Signal Quality
To continuously refine monitoring and alert workflows, operations teams must measure key operational performance indicators over time.
Key Performance Indicators for Alert Response
- Mean Time to Acknowledge (MTTA): The average duration from alert generation to confirmation by a primary responder. Lowering MTTA demonstrates effective notification routing and clear shift ownership.
- Mean Time to Repair (MTTR): The time required from initial alert generation to full system restoration. Reductions in MTTR directly reflect the clarity and effectiveness of operational runbooks.
- Noise-to-Signal Ratio: The proportion of total generated alerts versus actionable tickets requiring human intervention. Healthy operations target a noise-to-signal ratio below 20%.
- First-Contact Resolution Rate: The percentage of minor incidents resolved immediately during Tier-1 triage using standard runbooks without secondary escalation.
Regular monthly reviews of these metrics allow infrastructure managers to identify persistent telemetry anomalies, rewrite outdated runbooks, and deprecate redundant alerting rules.
Transform Infrastructure Monitoring into Operational Advantage
Raw monitoring data is only as valuable as the incident response framework behind it. By eliminating ambient alert noise, establishing clear role accountability, standardizing runbooks, and adjusting thresholds for multi-site network realities, organizations protect both their infrastructure stability and their engineering teams from burnout.
If your team is struggling with continuous alert noise, unclear escalation paths, or unmanaged multi-site telemetry, reach out to Bitscaled. Discover how our tailored monitoring and incident response services and managed IT infrastructure solutions transform raw alert feeds into proactive, decisive operational workflows. You can also evaluate your environment's posture using our DNS & SSL Health Tool or explore automated infrastructure management on our platform overview page.